Clockwork 5.0 released with client-side metrics, toolbar and more
Published at Sunday, November 15th 2020 by its
A new major Clockwork release is finally available. With UI refinements, client-side metrics, models and notifications tabs, sharing, toolbar and more.
Clockwork 5 supports the latest Laravel, Lumen, Slim and Symfony releases. To upgrade to the latest version simply change the version constraint in your composer.json:
"itsgoingd/clockwork": "^5.0",UI refinements
Almost every part of the Clockwork UI was touched up and improved. From simplified requests list, new tab bar, counters and tables to reworked dark theme colors.
The tab bar was completely reworked to be more clear and responsive. Every section now has consistent iconography. Tables now have always visible search fields. Request sidebar now shows basic request information. The clear button and requests search were moved to the requests list itself. Settings and "what's new" dialog use an all new modal style. Log messages now have linkified urls. These are just few highlights.
You will also find a new "credits" link in the settings modal. This opens a credits modal with a little shout-out to all contributors, sponsors and used third-party dependencies.
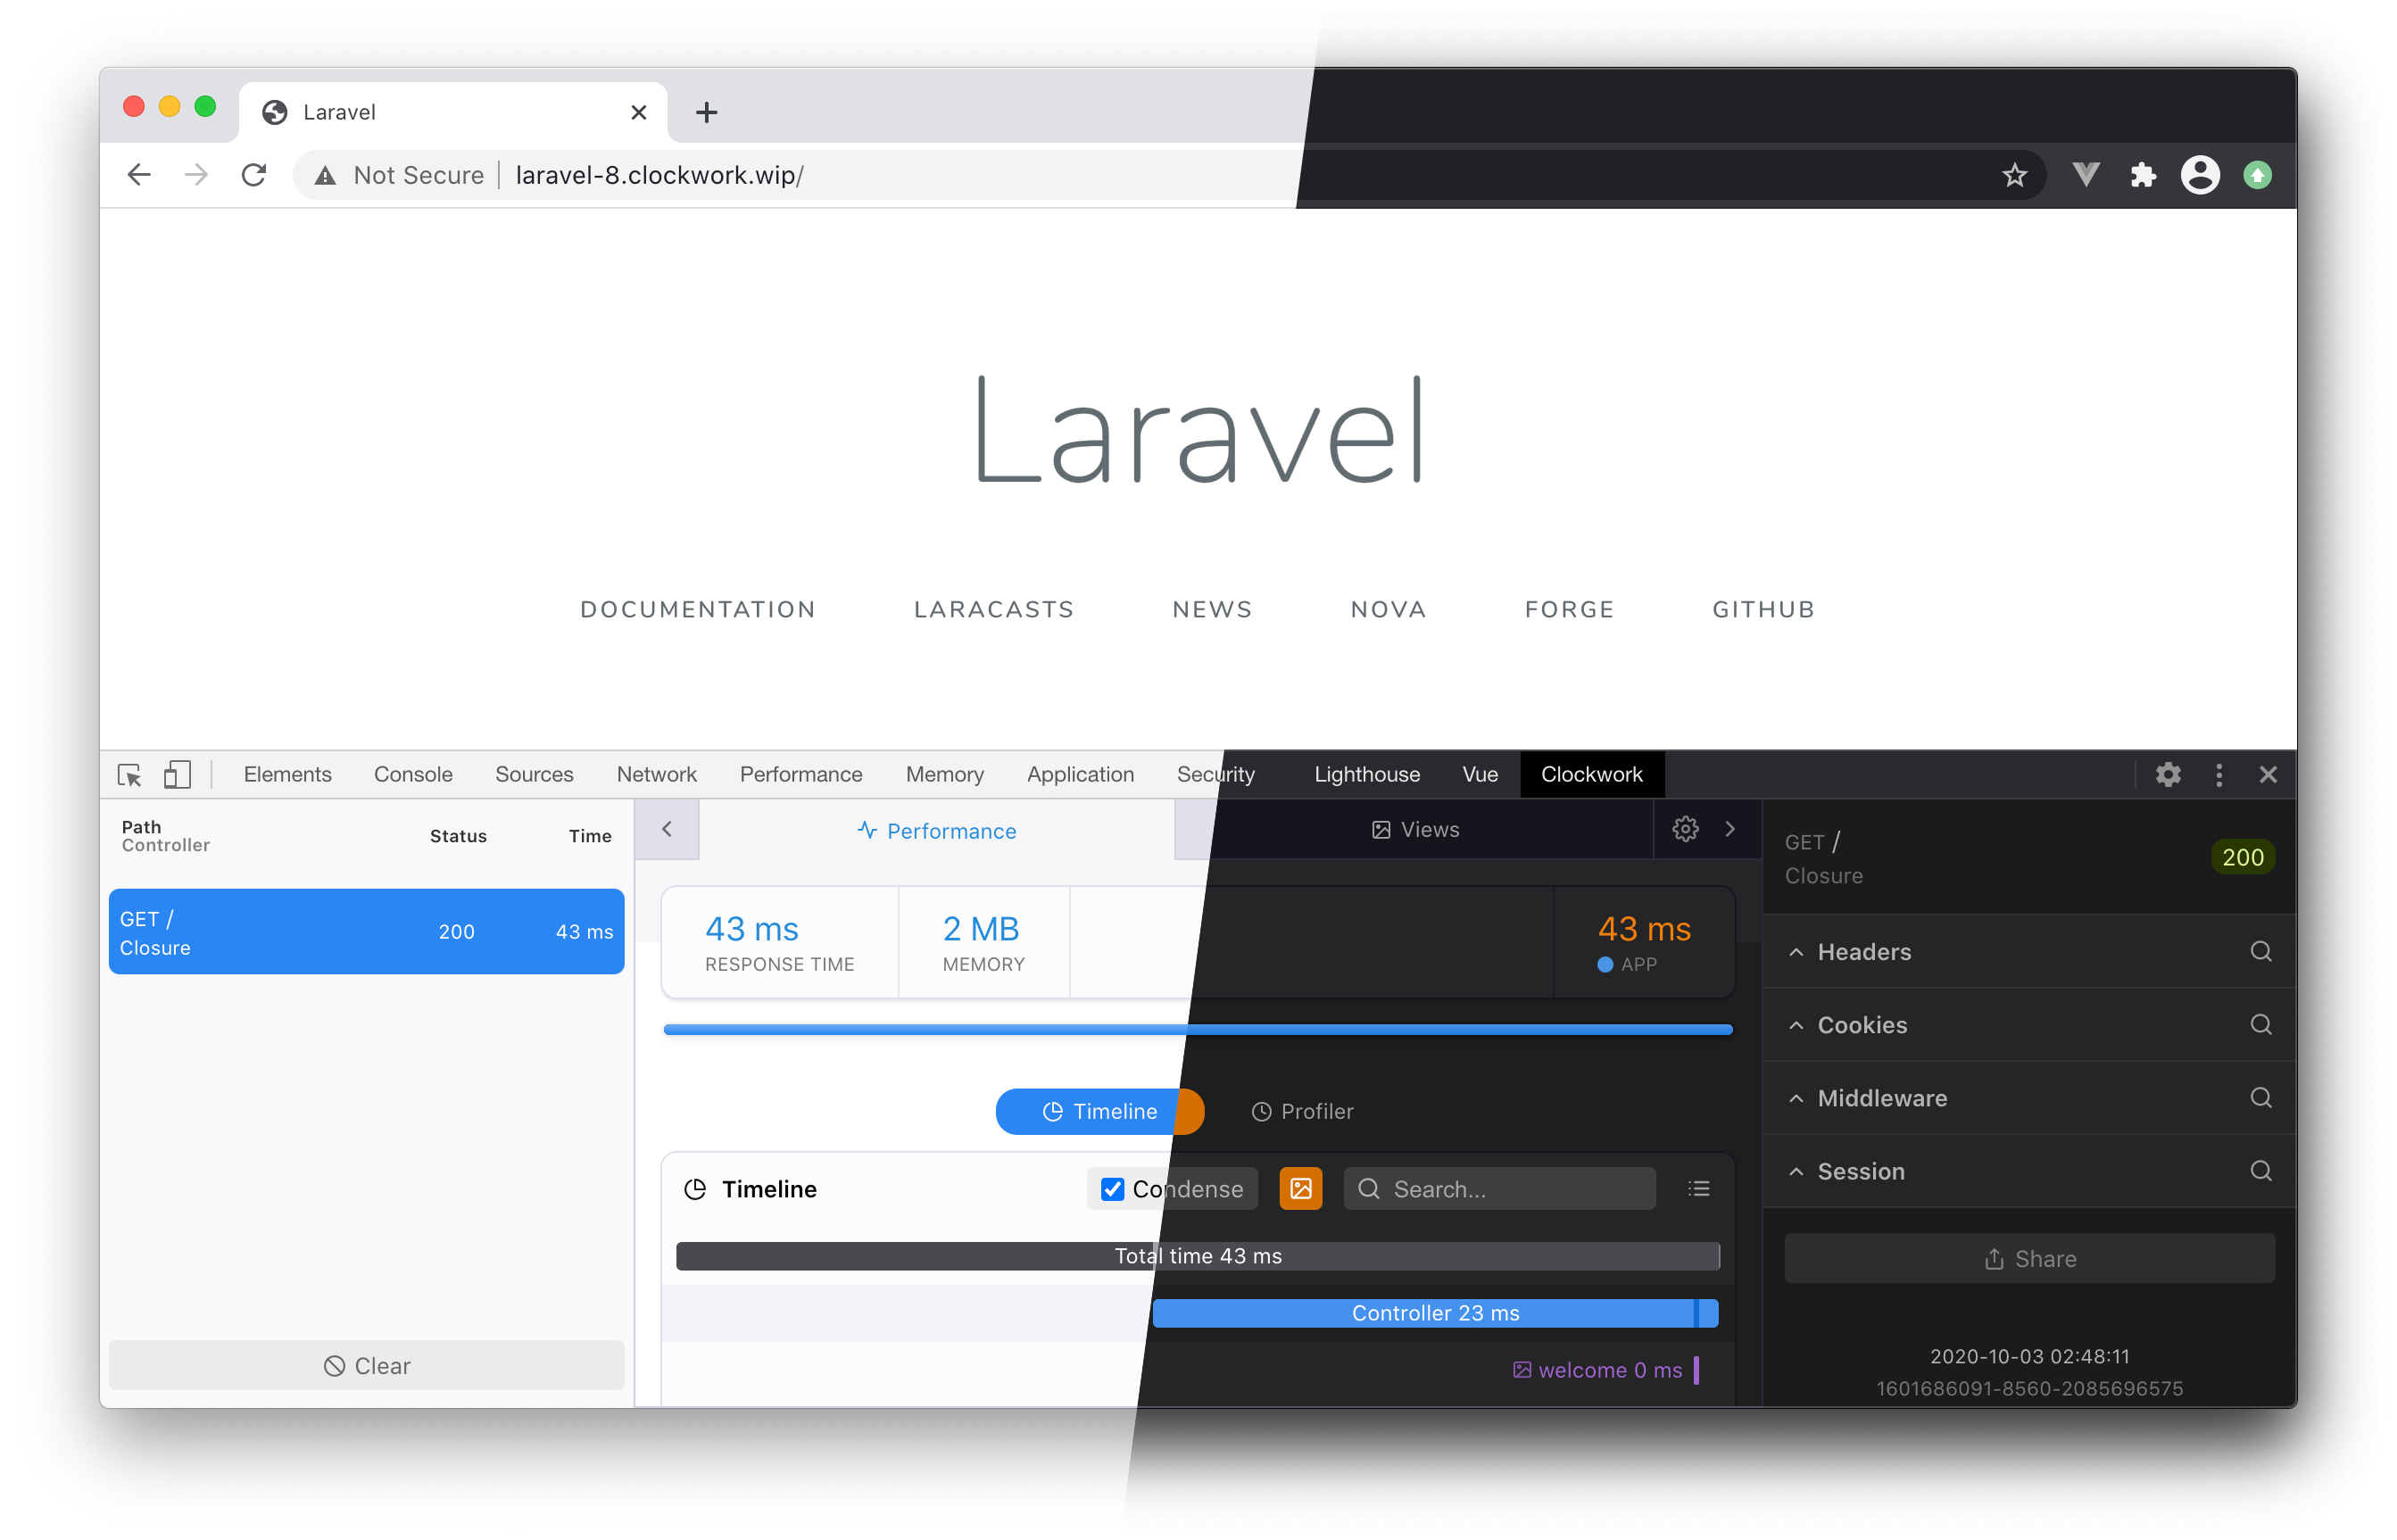
Timeline
Timeline was rebuilt from the ground up in this release. The new timeline makes it easier than ever before to figure out what's happening in your application. The condense option makes the timeline more compact by condensing multiple short events into a single row. The bar colors now represent the event type and show the self and children time in different shades. Clicking on an event now reveals a popover with more details. And of course you can still filter by event type, search and show details view.
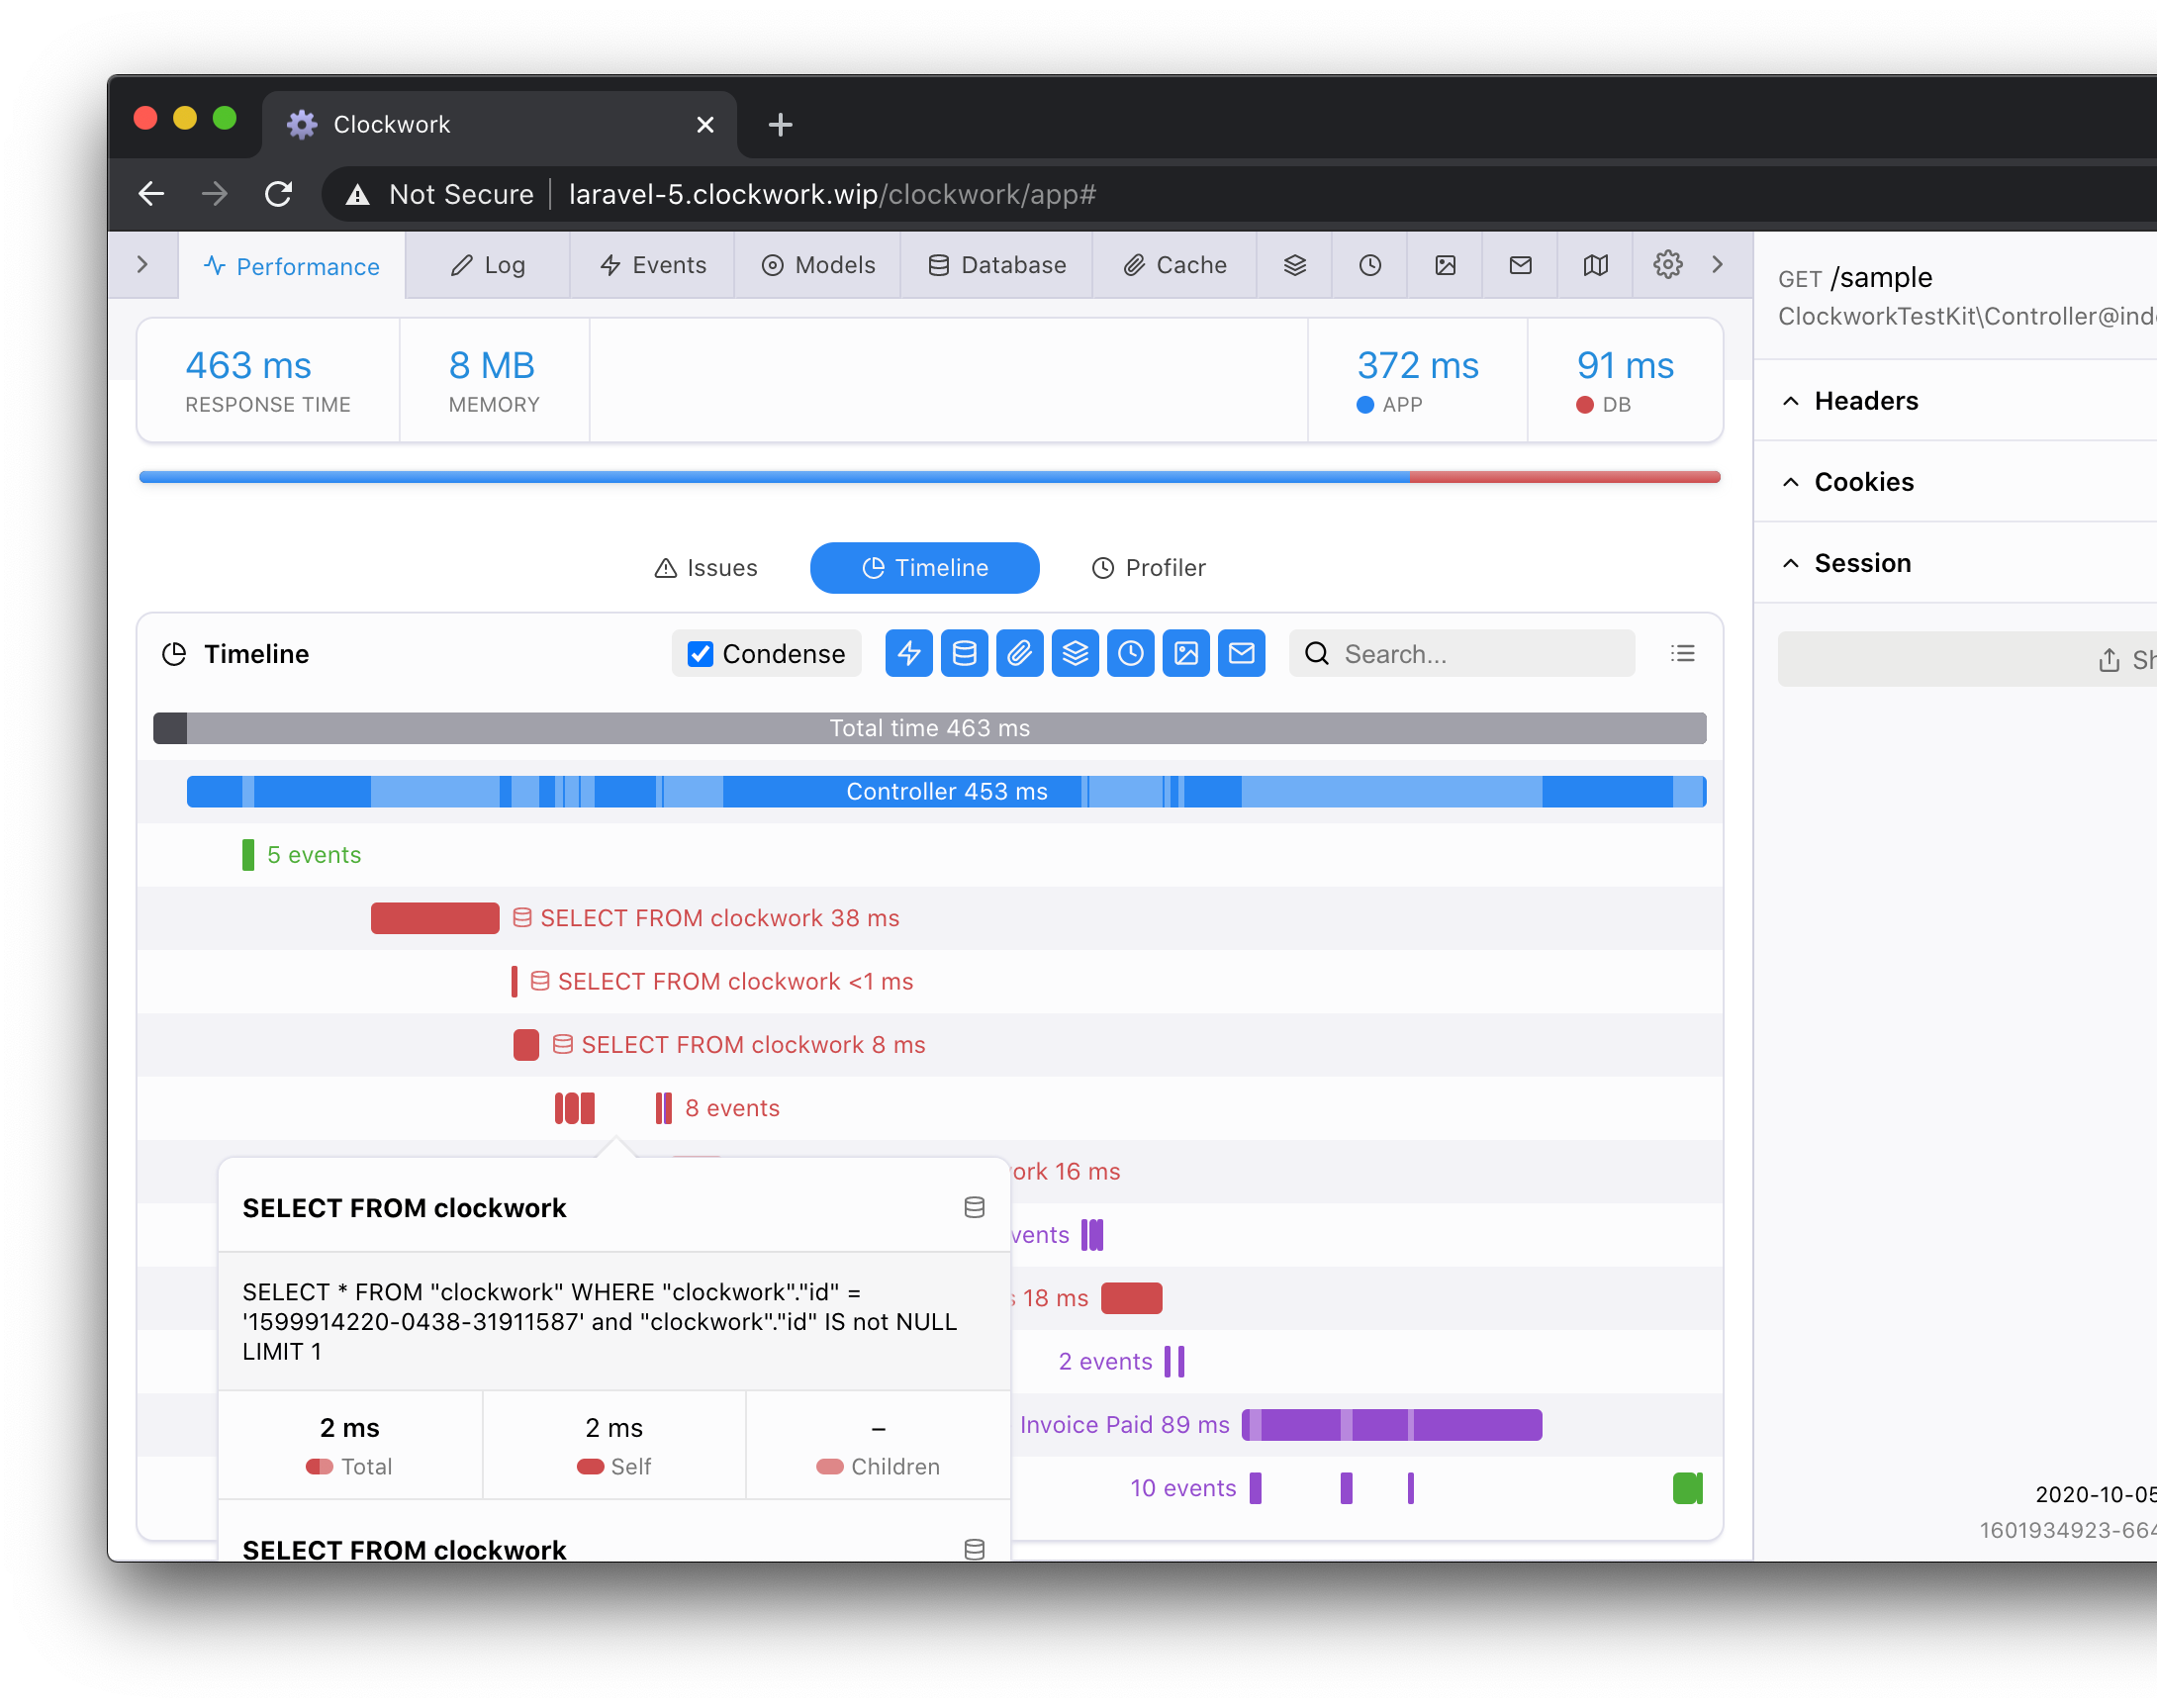
The timeline api on server-side was also completely reworked. It's way more developer-friendly and supports custom event colors. See the updated docs for details and how to upgrade an existing project. The default Laravel initializing events were also replaced with a way more useful controller event.
// using timeline api with begin/end and fluent configuration
clock()->event('Importing tweets')->color('purple')->begin();
...
clock()->event('Importing tweets')->end();

// using timeline api with run and array-based configuration
clock()->event('Updating cache', [ 'color' => 'green' ])->run(function () {
    ...
});
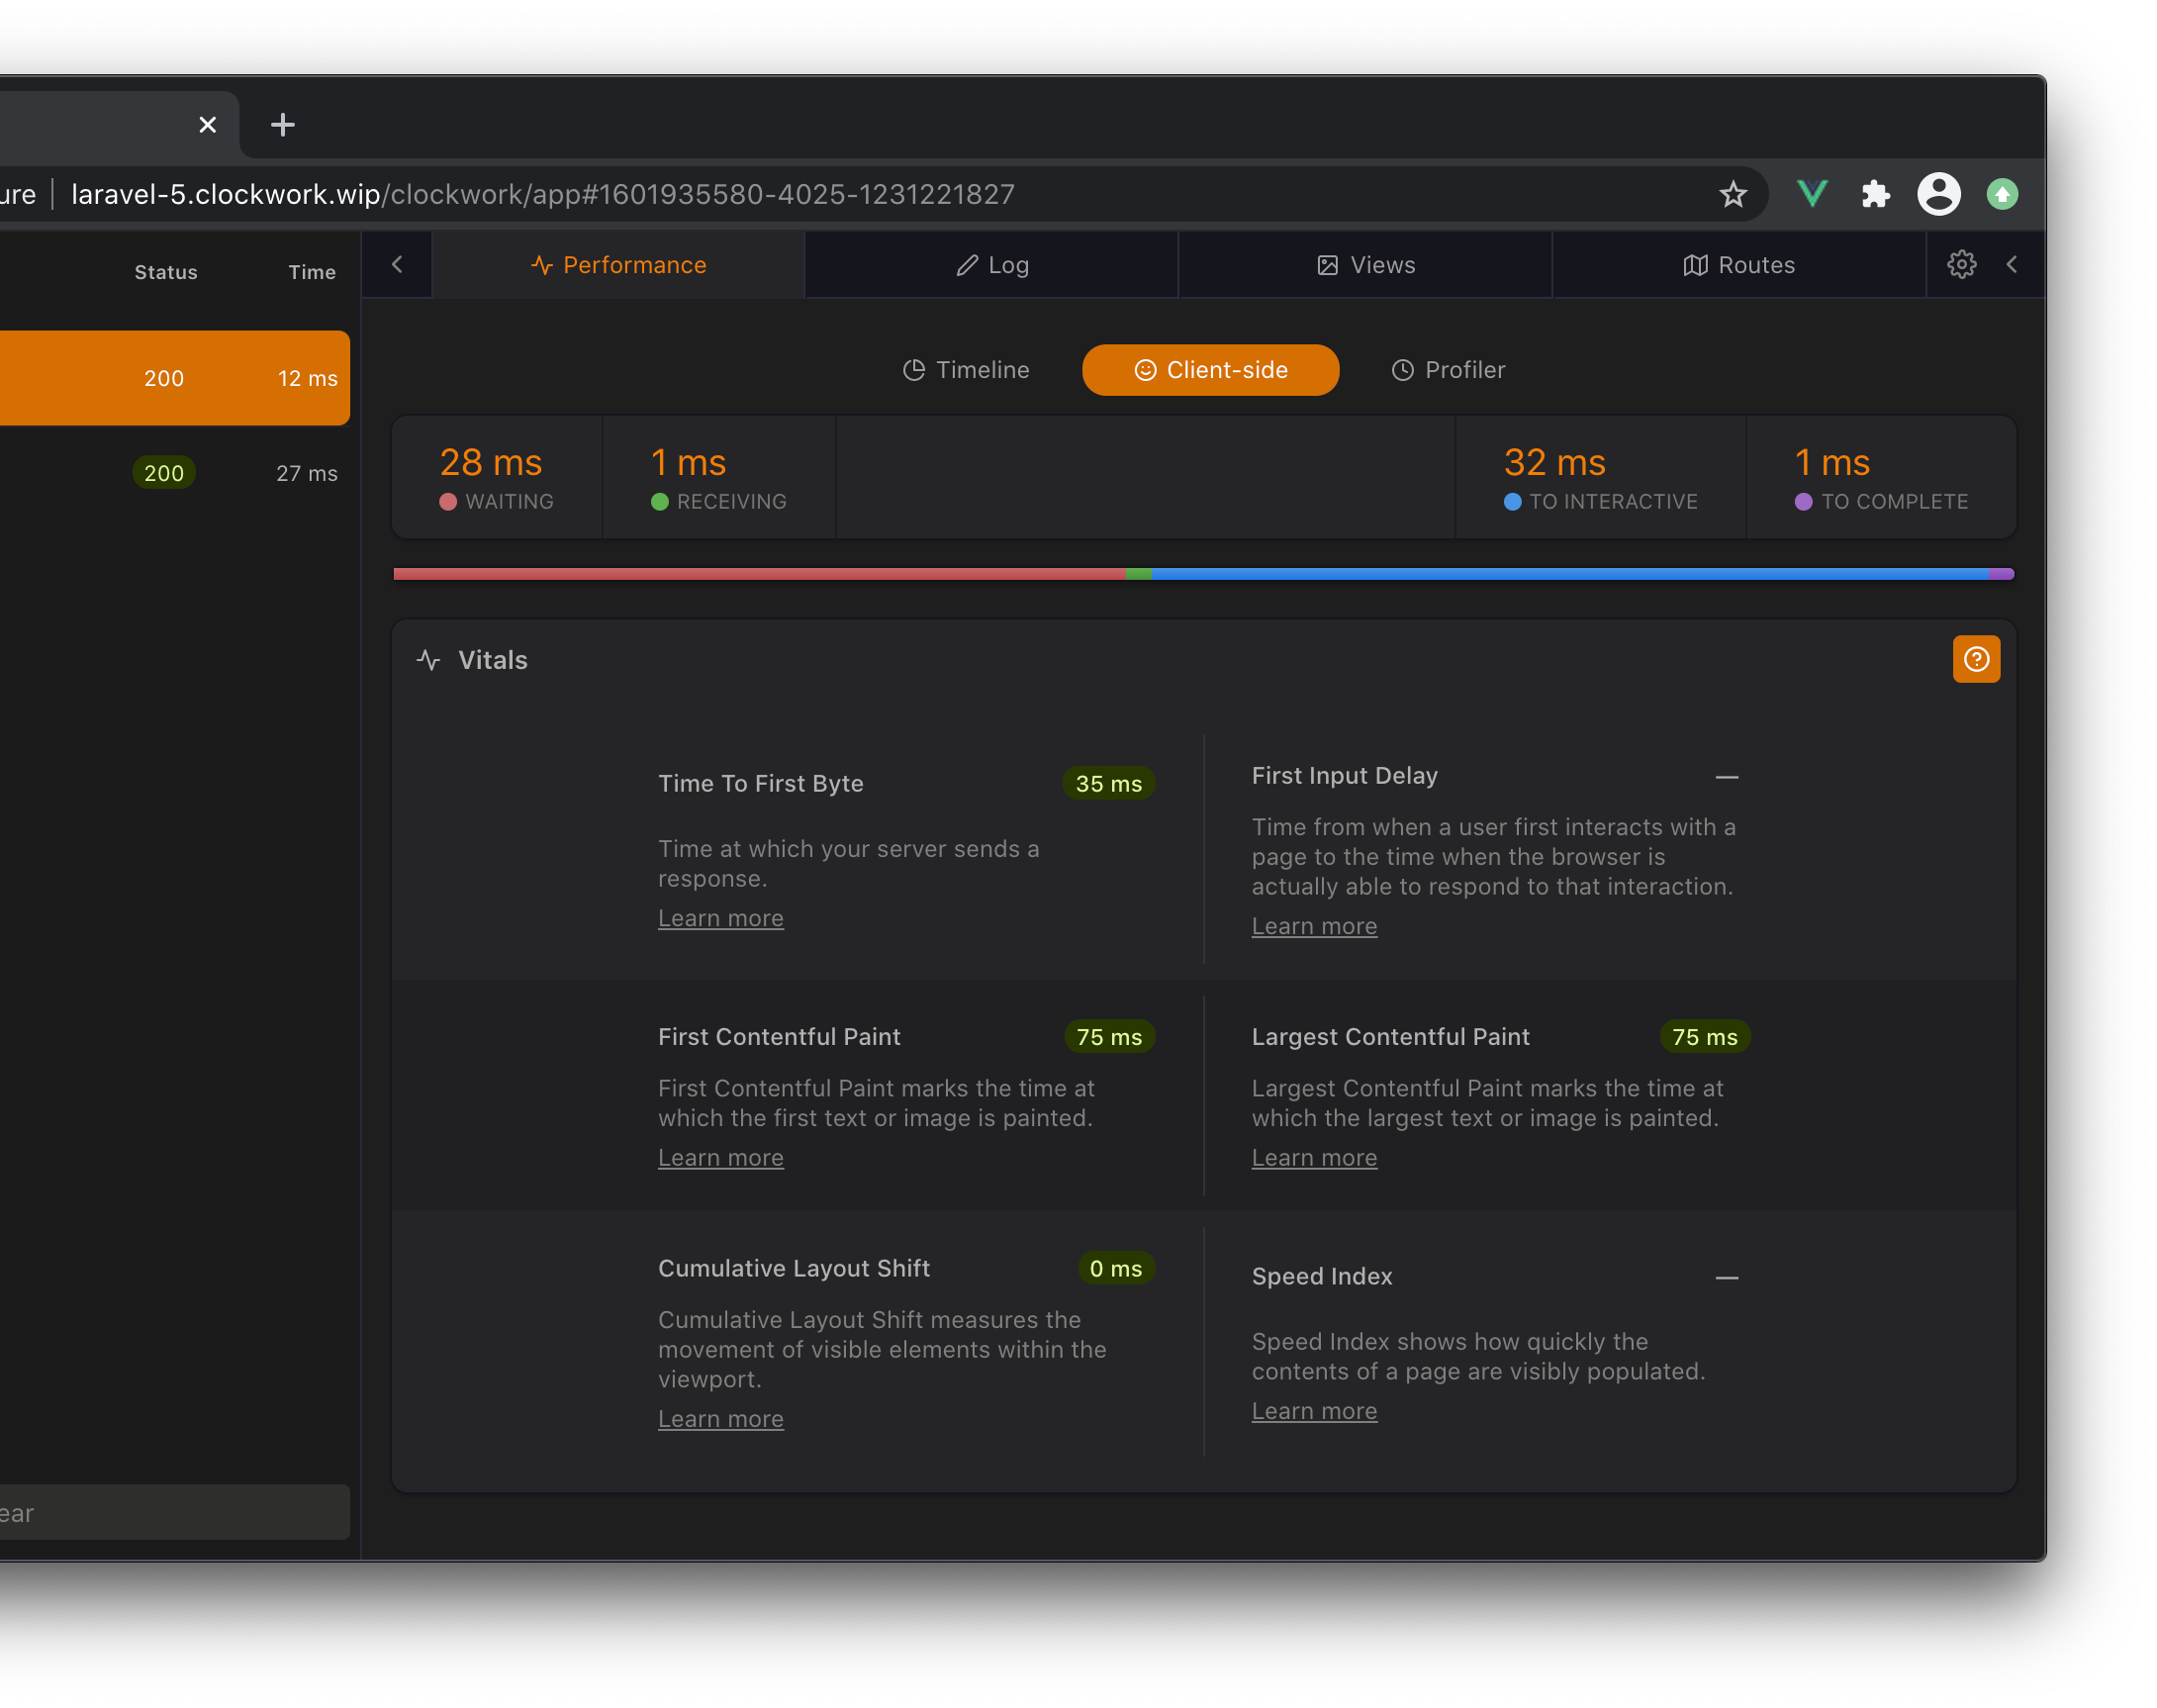
Client-metrics and Web Vitals
Clockwork helps you to keep your server-side performance in check. Optimizing the backend is just half of the battle though. Javascript processing can still make your application feel sluggish. Fortunately we have some great web performance intiatives like Web Vitals and browser apis to help us measure how are we doing on this front.
With Clockwork 5 you are now be able to collect these client-side performance metrics. Supported are both navigation timings (like how long it took for the DOM interactive or complete event) and Web Vitals. You will find the collected metrics in a new client-side section in the performance tab.
Collecting client-side metrics requires installing a tiny javascript library from npm or simply linking <script> from a cdn. Check the docs for more details.
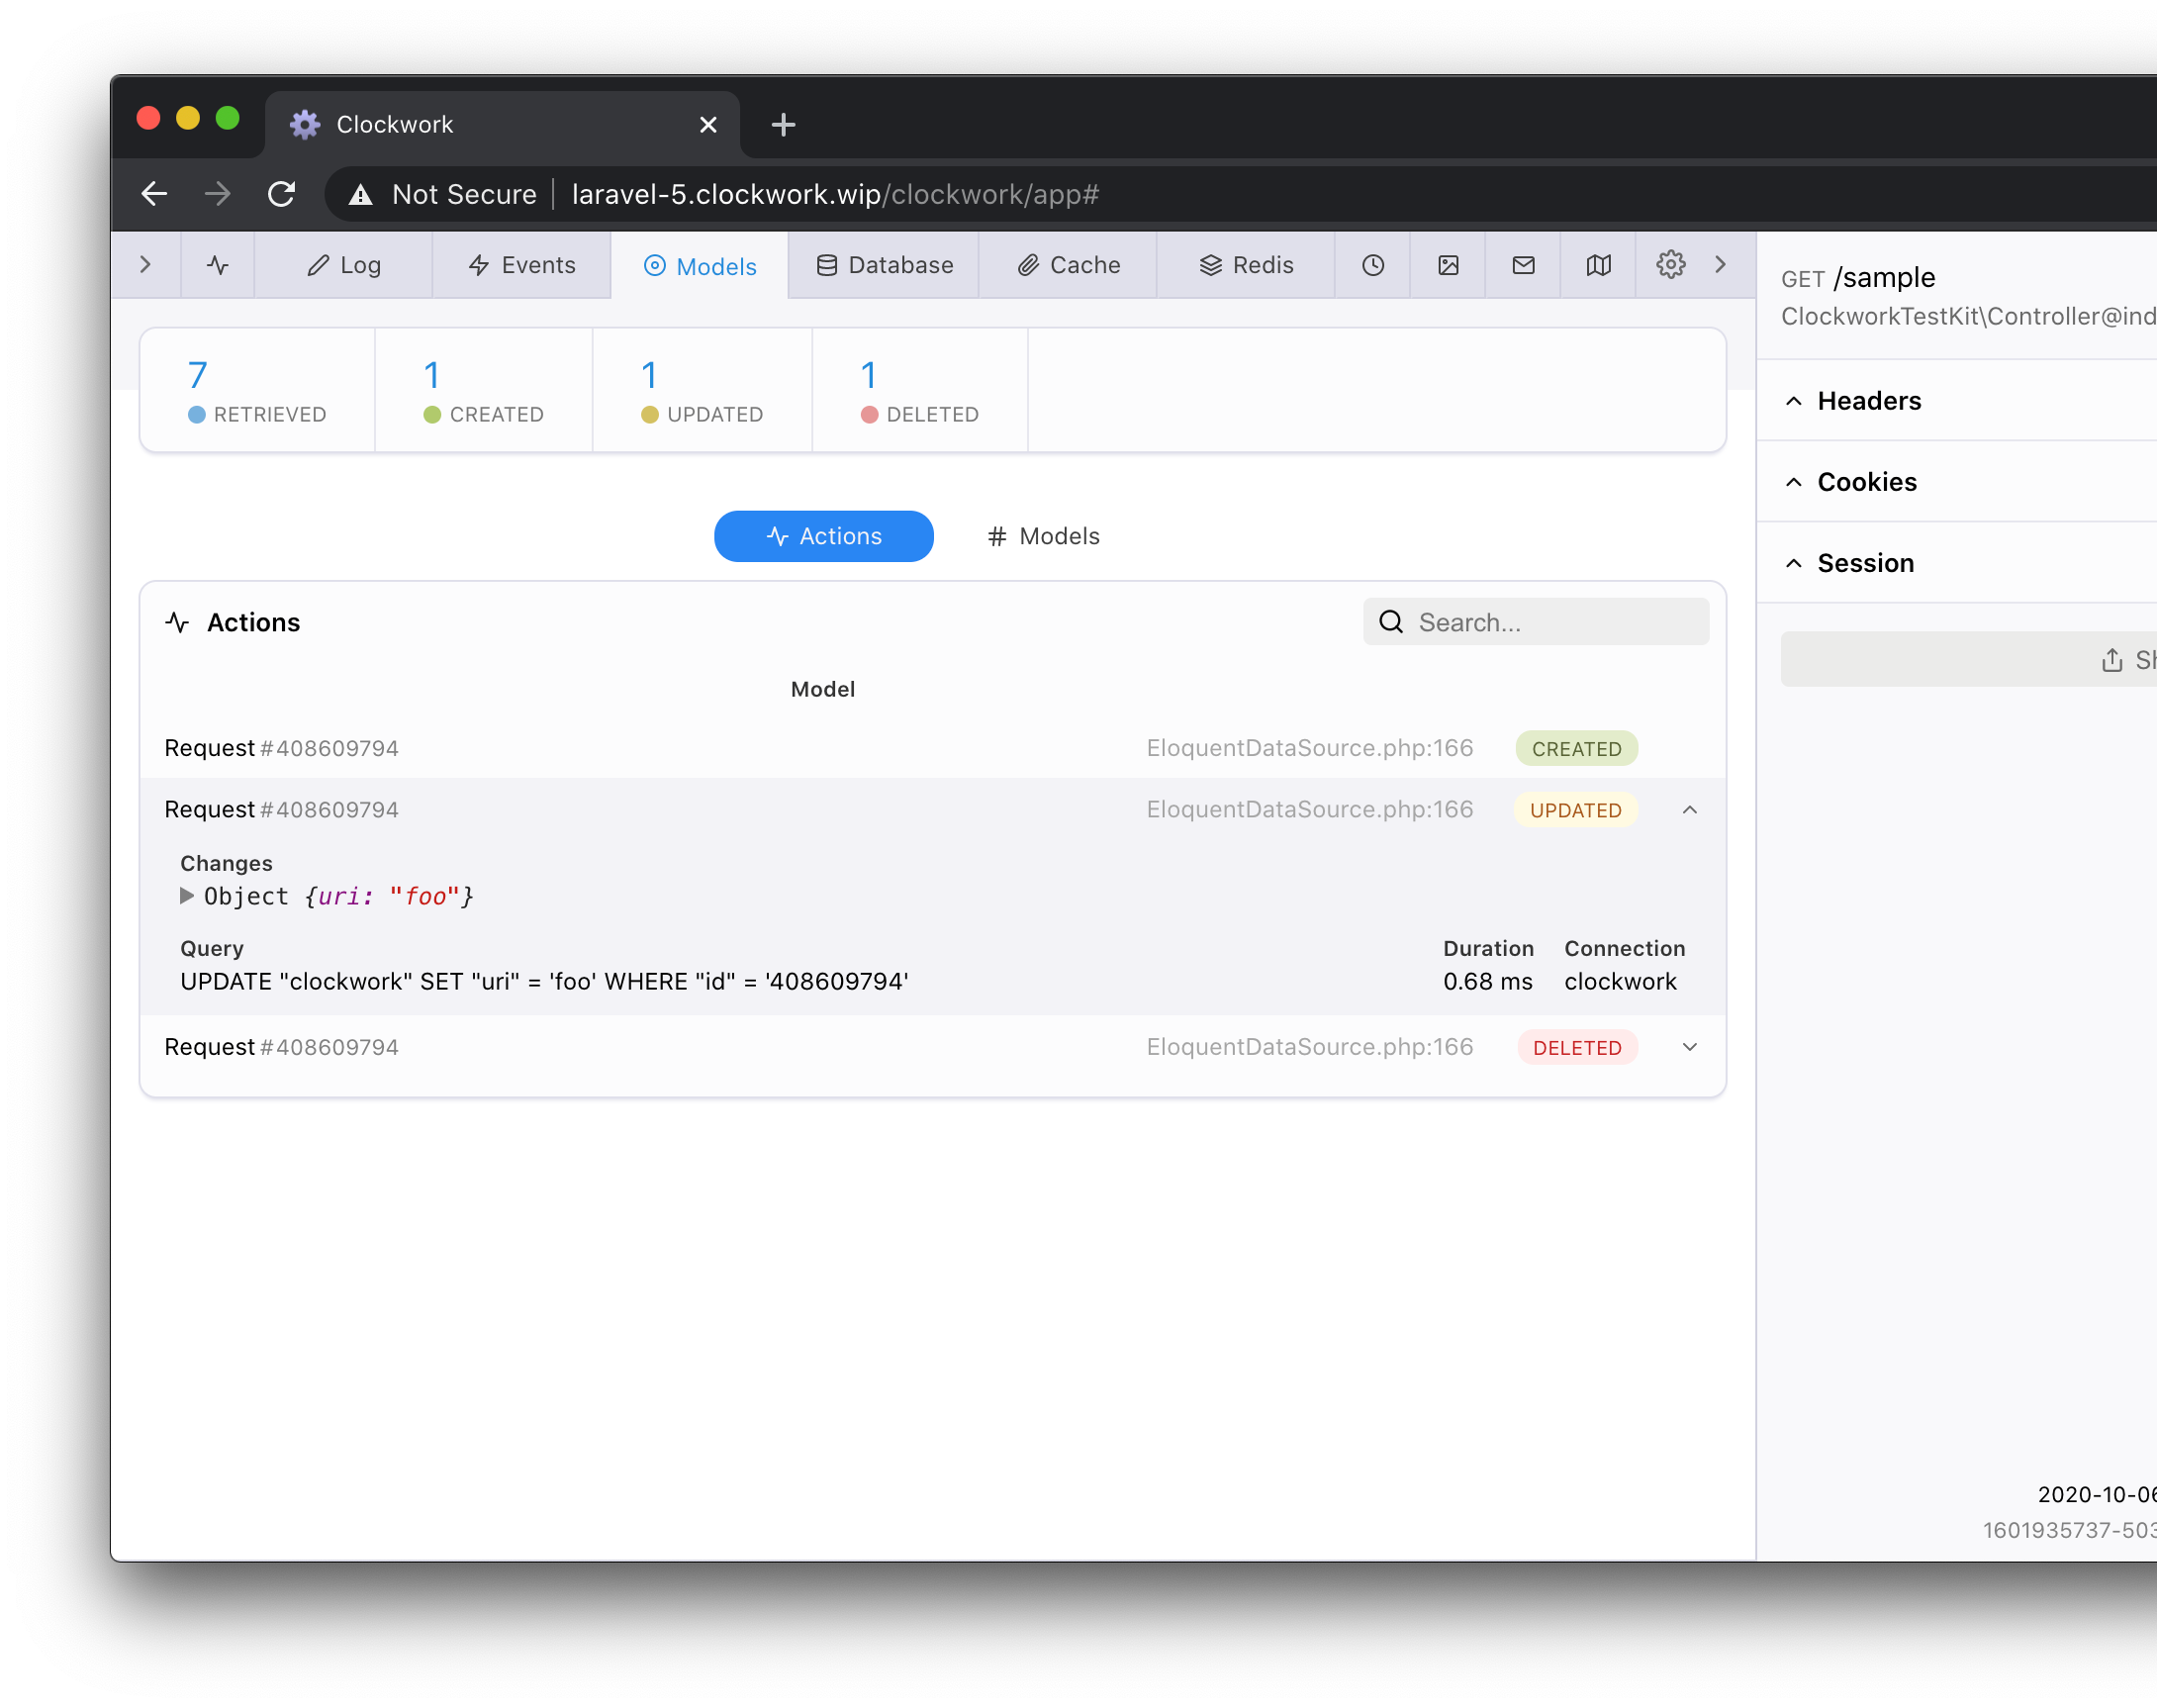
Models tab
Models tab is a new tool in your toolbelt for dealing with database issues. Models actions give you a different point of view at your database usage. You can see see every time a model was retrieved, created, updated or deleted, with primary keys and even changed data and executed query. Models counts will show you how many of each model you've retrieved, created, updated and deleted.
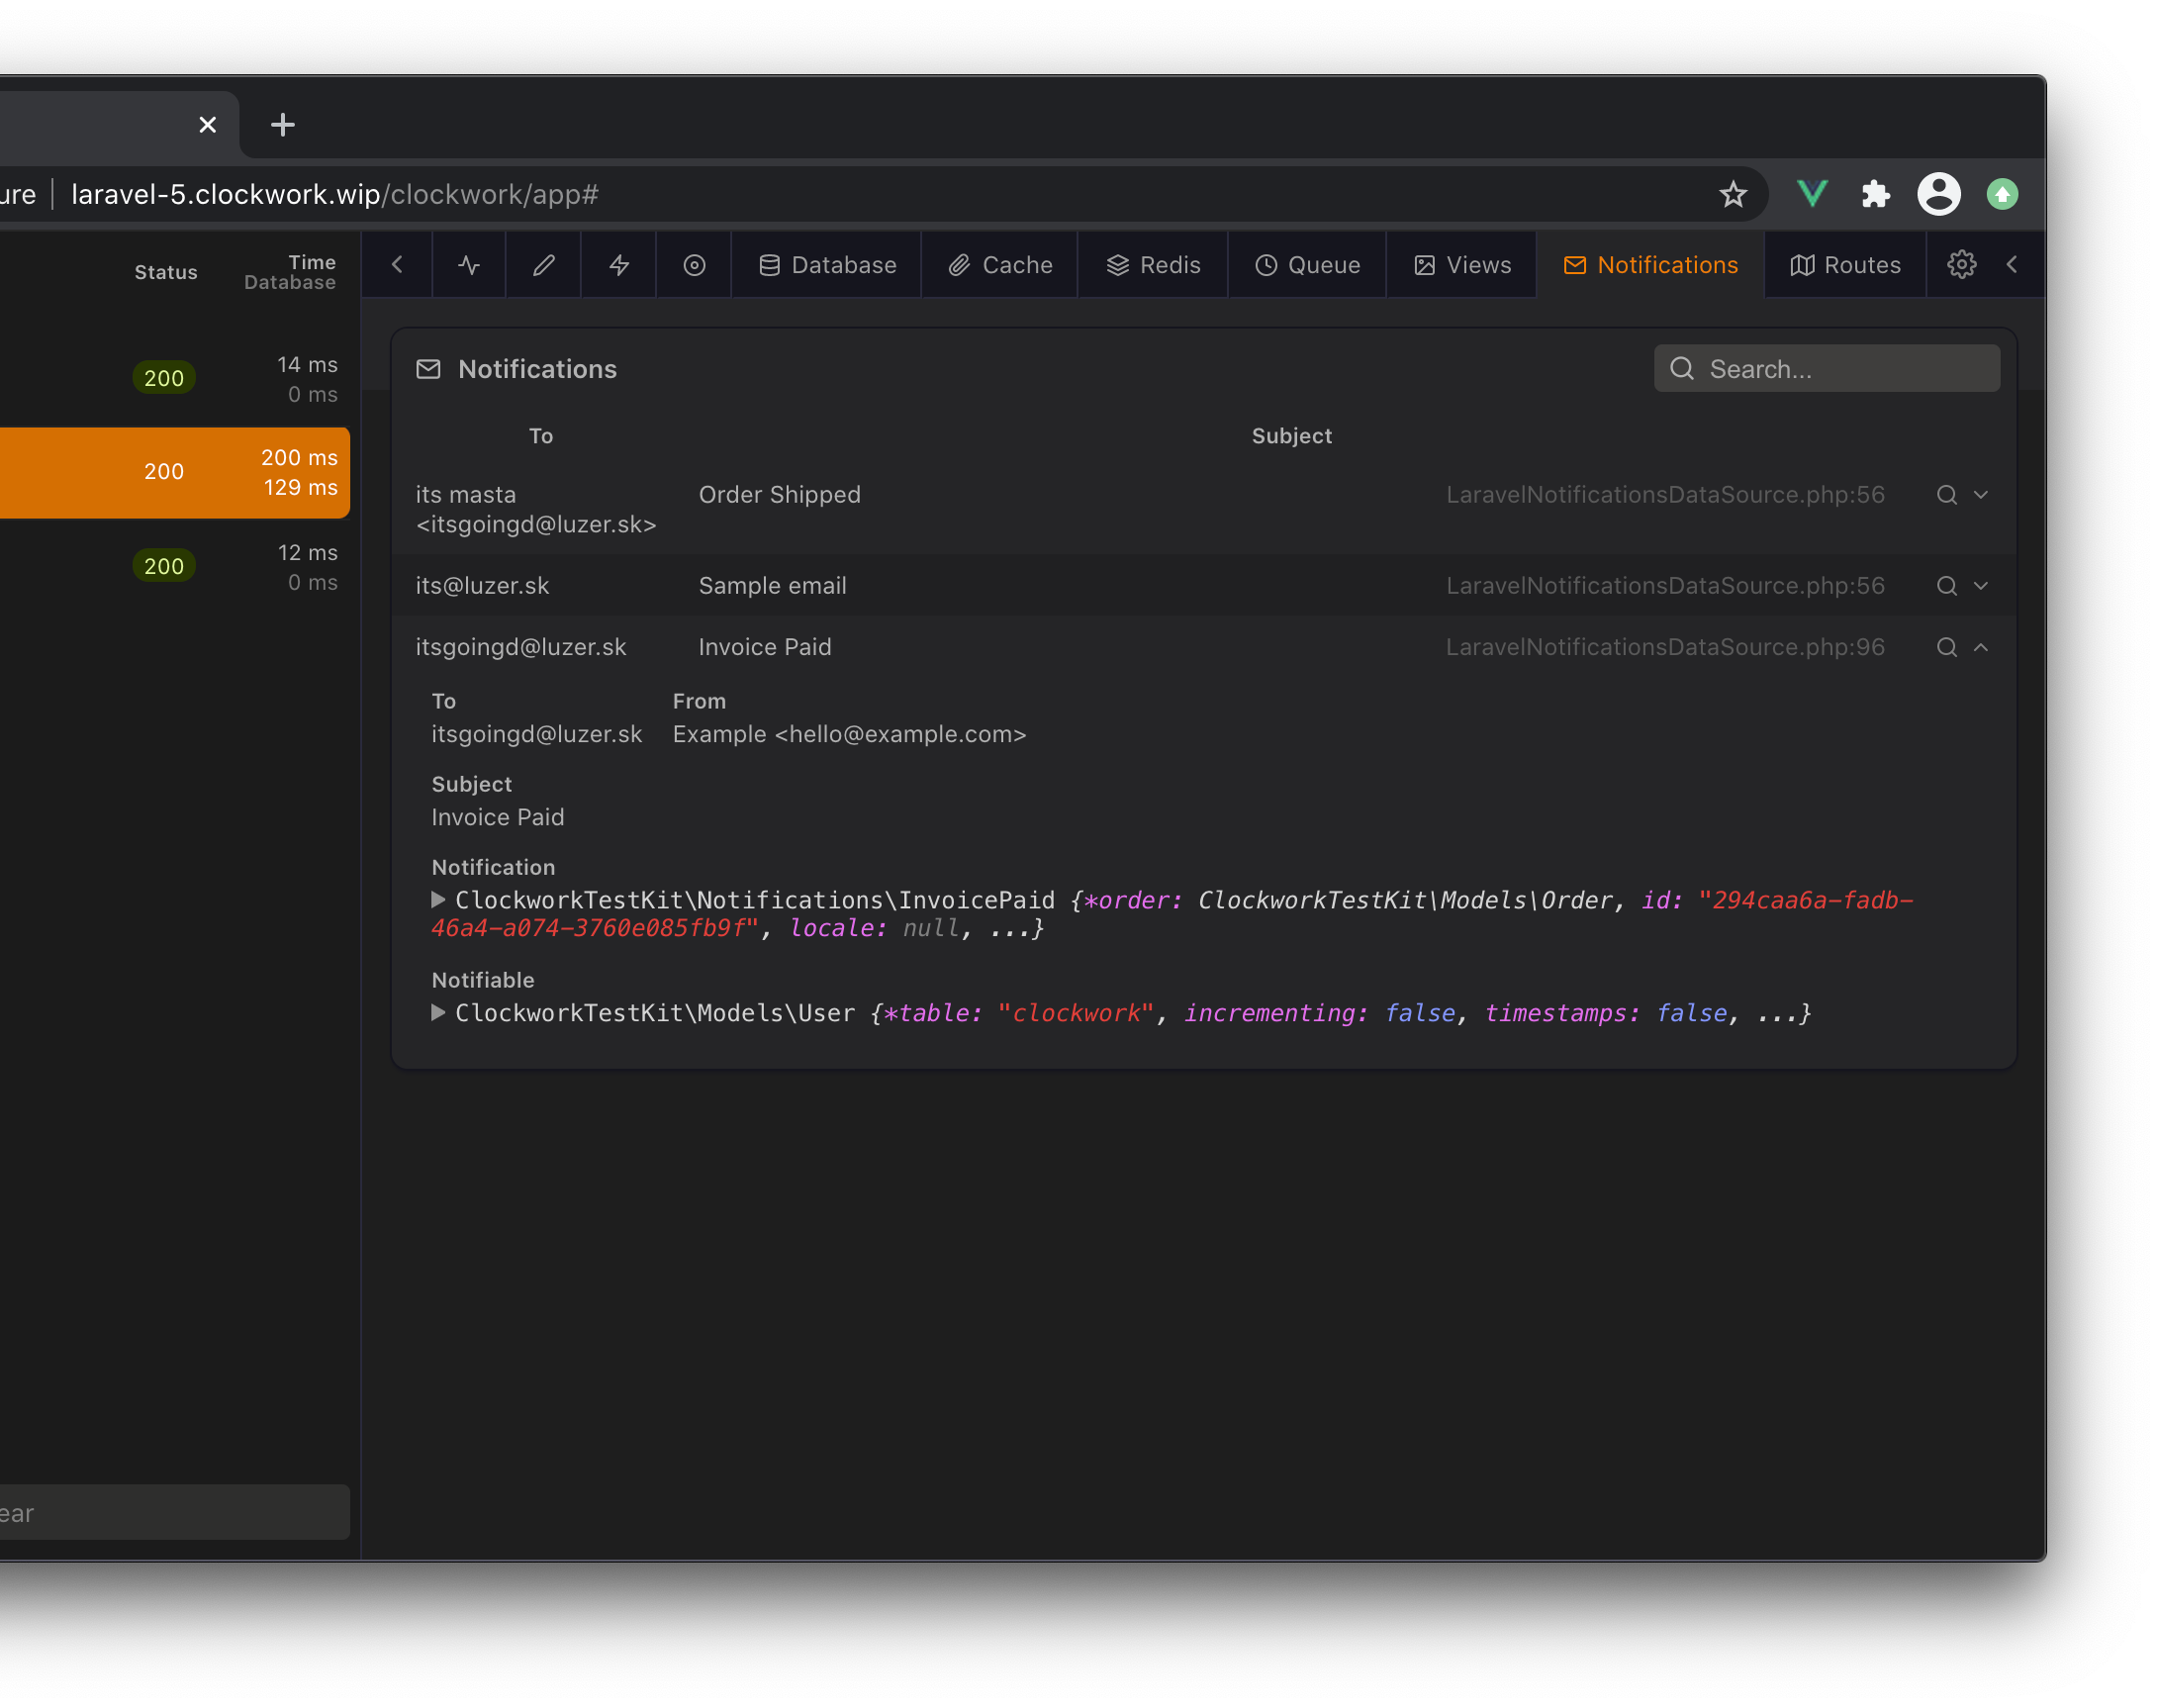
Notifications tab
Notifications tab is a new tab replacing the emails tab. This time we support not only emails, but all kinds of notifications, like SMS or Slack messages. With details like subject, recipient, sender, but also notifiable, notified and mailable objects in Larvel. You can also preview sent emails content.
Sharing
Have you ever wanted to share a Clockwork profile with someone else? Maybe you'd like to share details of a crash from a local environment with a co-worker. Or before and after optimisation metrics with your boss.
Sharing a request uploads the metadata to a Clockwork share service and gives you a public link to share with others. On this link you will find a fully working Clockwork app showing the request you shared. Append .png to the url and you will get a screenshot of the performance tab you can easily embed to a GitHub issue. You can also choose to share only part of the request, like the database tab.
The share service is free to use. The shared data is hosted on DigitalOcean servers and will never be shared with third-parties. Old shares will be purged form time to time. You can also delete the shared requests manually at any time.
Sometimes you might just want to link to a request on your own Clockwork instance. You will find that the request id on the bottom of the sidebar now links to the current request.
Toolbar
Many of the popular web profilers, like Laravel Debugbar or Symfony Profiler, come with a sort of toolbar injected to your website, showing the collected metrics. In Clockwork I went with a different approach, keeping the profiler separate from the rest of the app.
The toolbar approach has some unique advantages though. With a separate profiler you need to go looking for the profiling data, with a toolbar you always have your eyes on the metrics. This can help you notice performance issues that you wouldn't normally look for.
If you like this approach, Clockwork now gives you the option. We still don't inject anything into your website, instead the whole toolbar is implemented client-side. The toolbar has to be enabled in the config and a tiny browser component installed from npm or simply <script> linked from cdn. See the docs for full installation instructions.
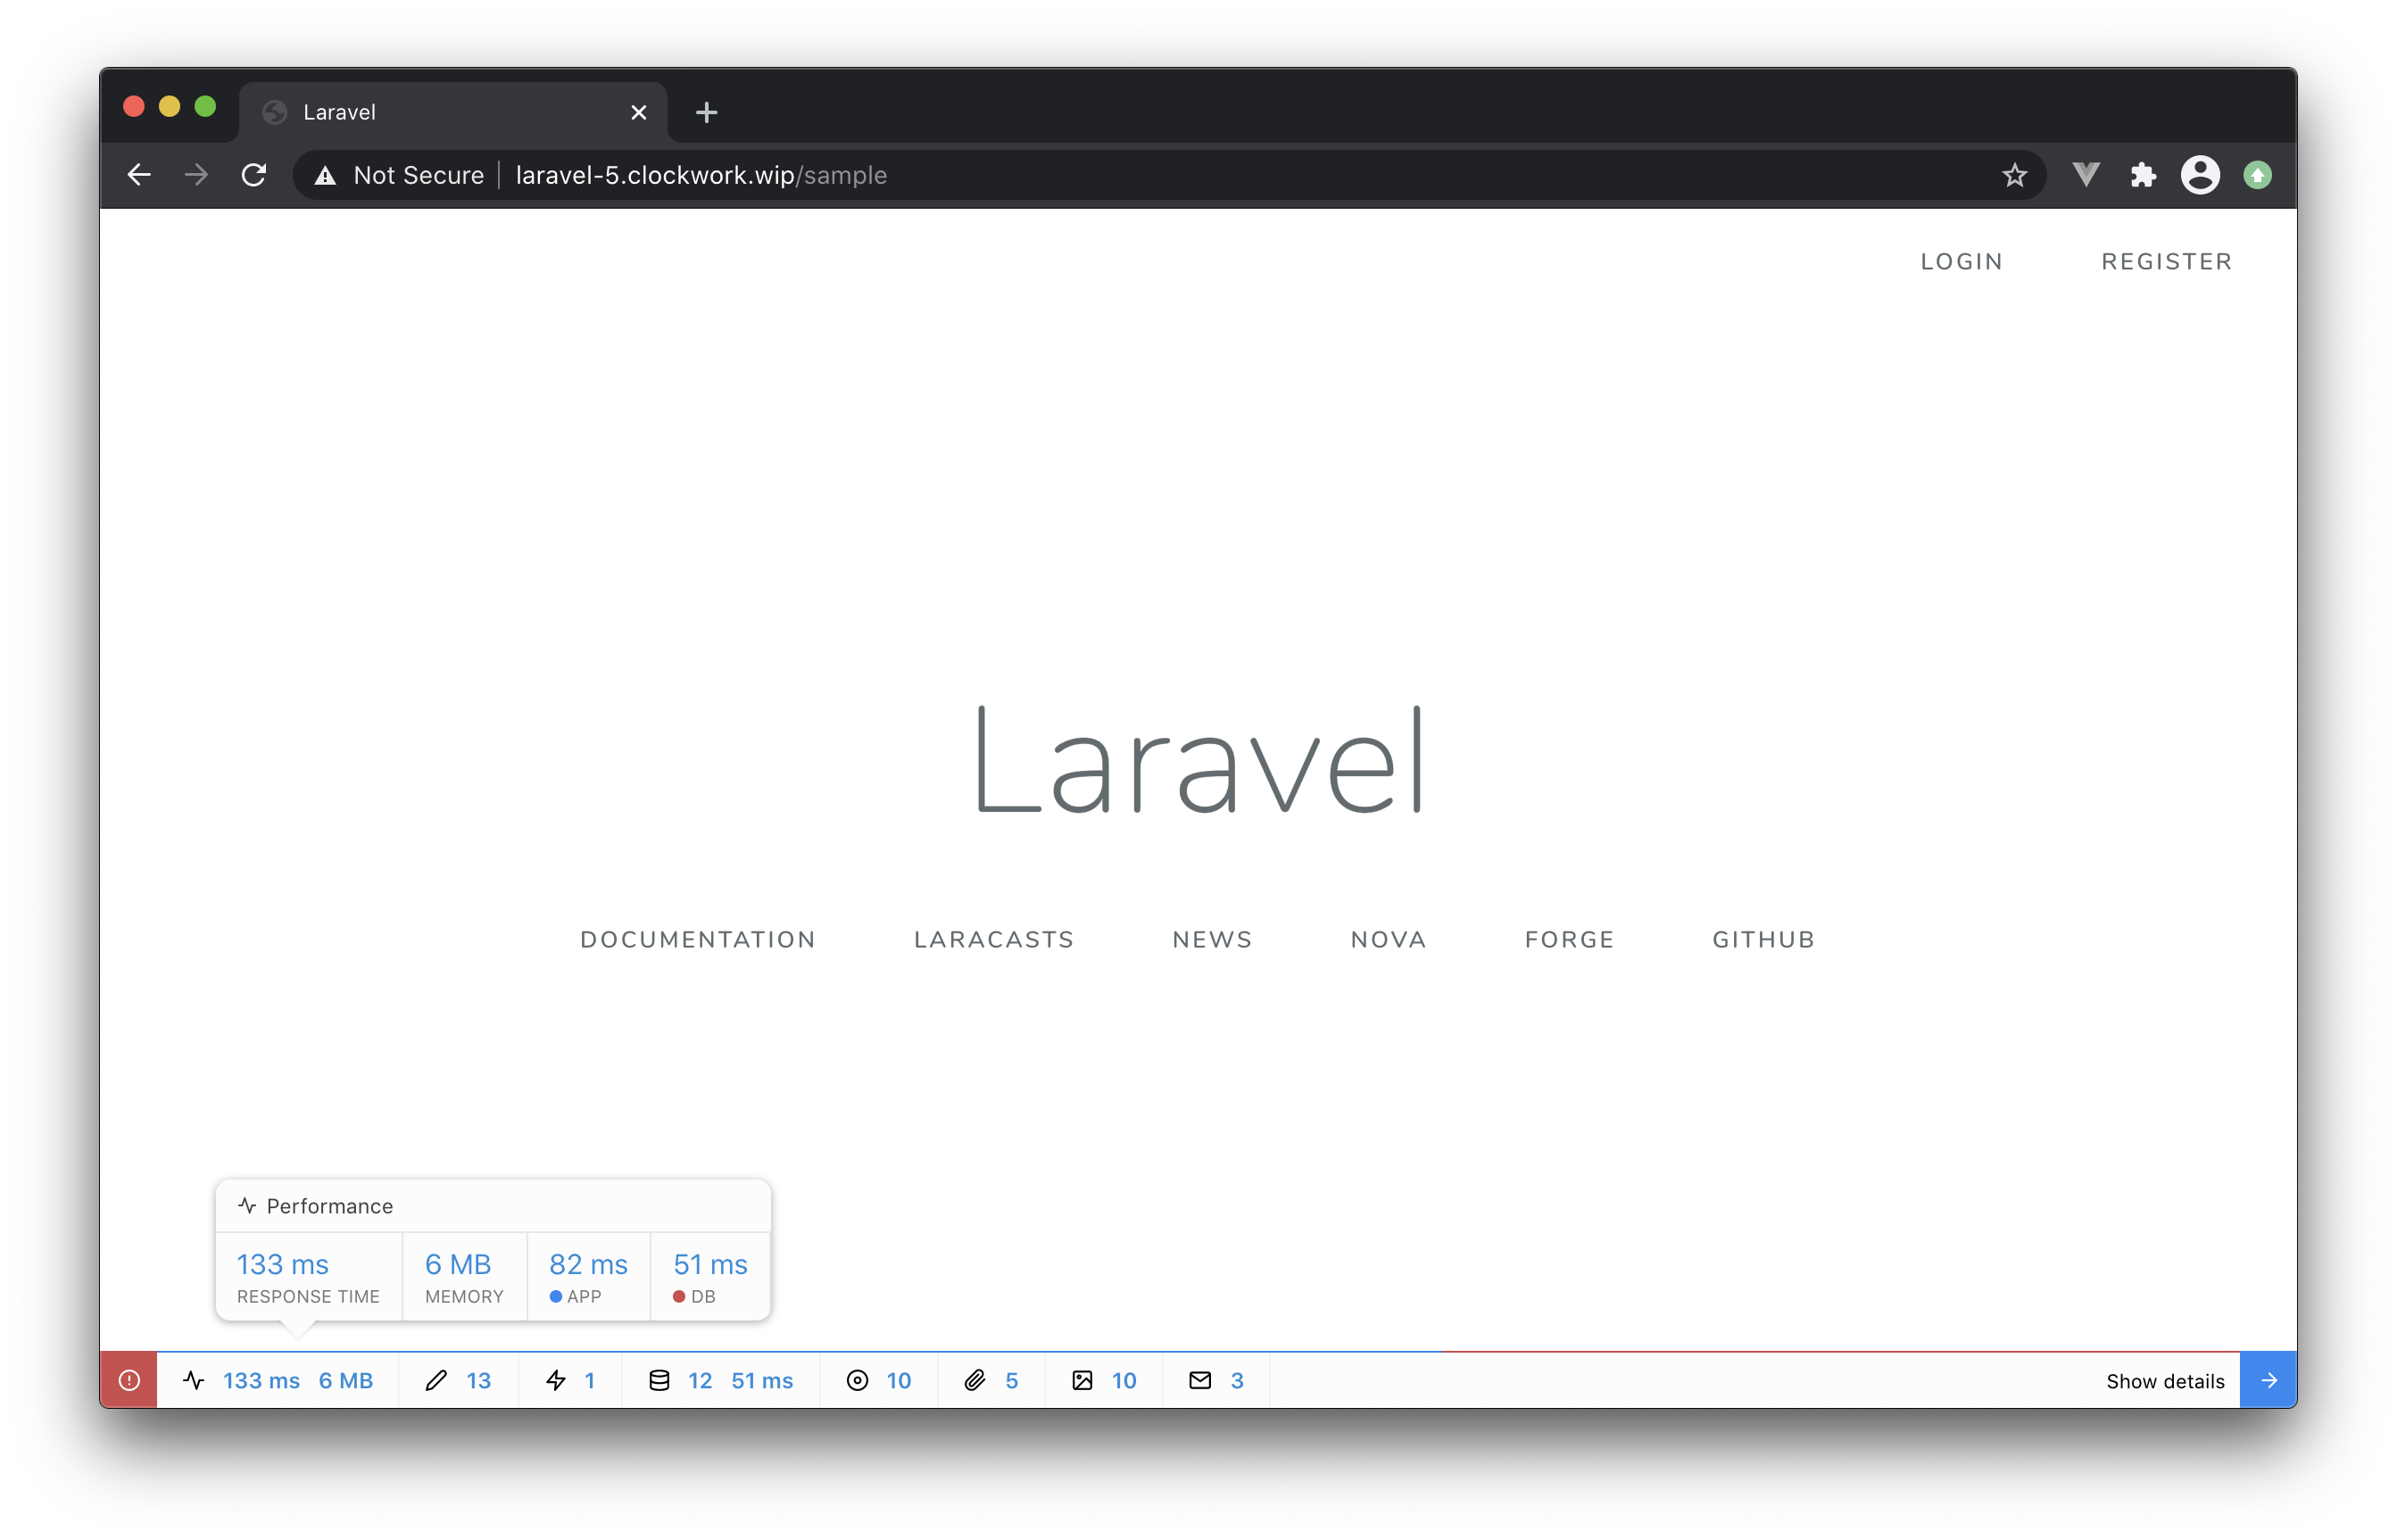
The toolbar shows only simple metrics. Clicking on the blue arrow will open Clockwork app with full details.
Other improvements
Clockwork 5 also comes with some behind the scenes improvements. Loading of the metadata is now automatically retried and has better error handling. The polling interval is now dynamically increased when there are no requests to show, lowering the load on your server. Polling throttling for inactive tabs now also works in extension. Partial loads of the metadata are now possible.
The Clockwork php library comes with a bundled Clockwork app. The default path for this web UI is now your.app/clockwork. You can also change this path in the Clockwork config.
The php library now gives you a lot more options on which requests to collect and record. On-demand mode will collect data only when Clockwork app is open. You can even specify a secret to be set in the app settings to collect request. Errors only will record only requests ending with 4xx and 5xx responses. Slow only will collect only requests with responses above the set slow threshold. You can also filter the collected and recorded requests by a custom closure. CORS pre-flight requests will not be collected by default.
Requests recording was moved to a terminate callback. This lowers the overhead Clockwork has on your response time by up to 50%. A Slim 4 support has also been added.
Breaking changes and community
As this is a major release it comes with a few breaking changes. By far the biggest change is the reworked timeline api, please check the documentation on how to upgrade. Laravel config file had multiple changes, please review and re-publish if using a customized one. Slim middleware namespaces have changes, please see the documentation. Minimal supported PHP version was bumped to 5.6.
For more extensive info about new features and breaking changes see the full changelog.
If you've enjoyed this release you can consider sponsoring or joining our Discord community. As always, feel free to contact me with any feedback on GitHub, twitter or email.